
E-Waste Statistics India 2026 – Bangalore Impact
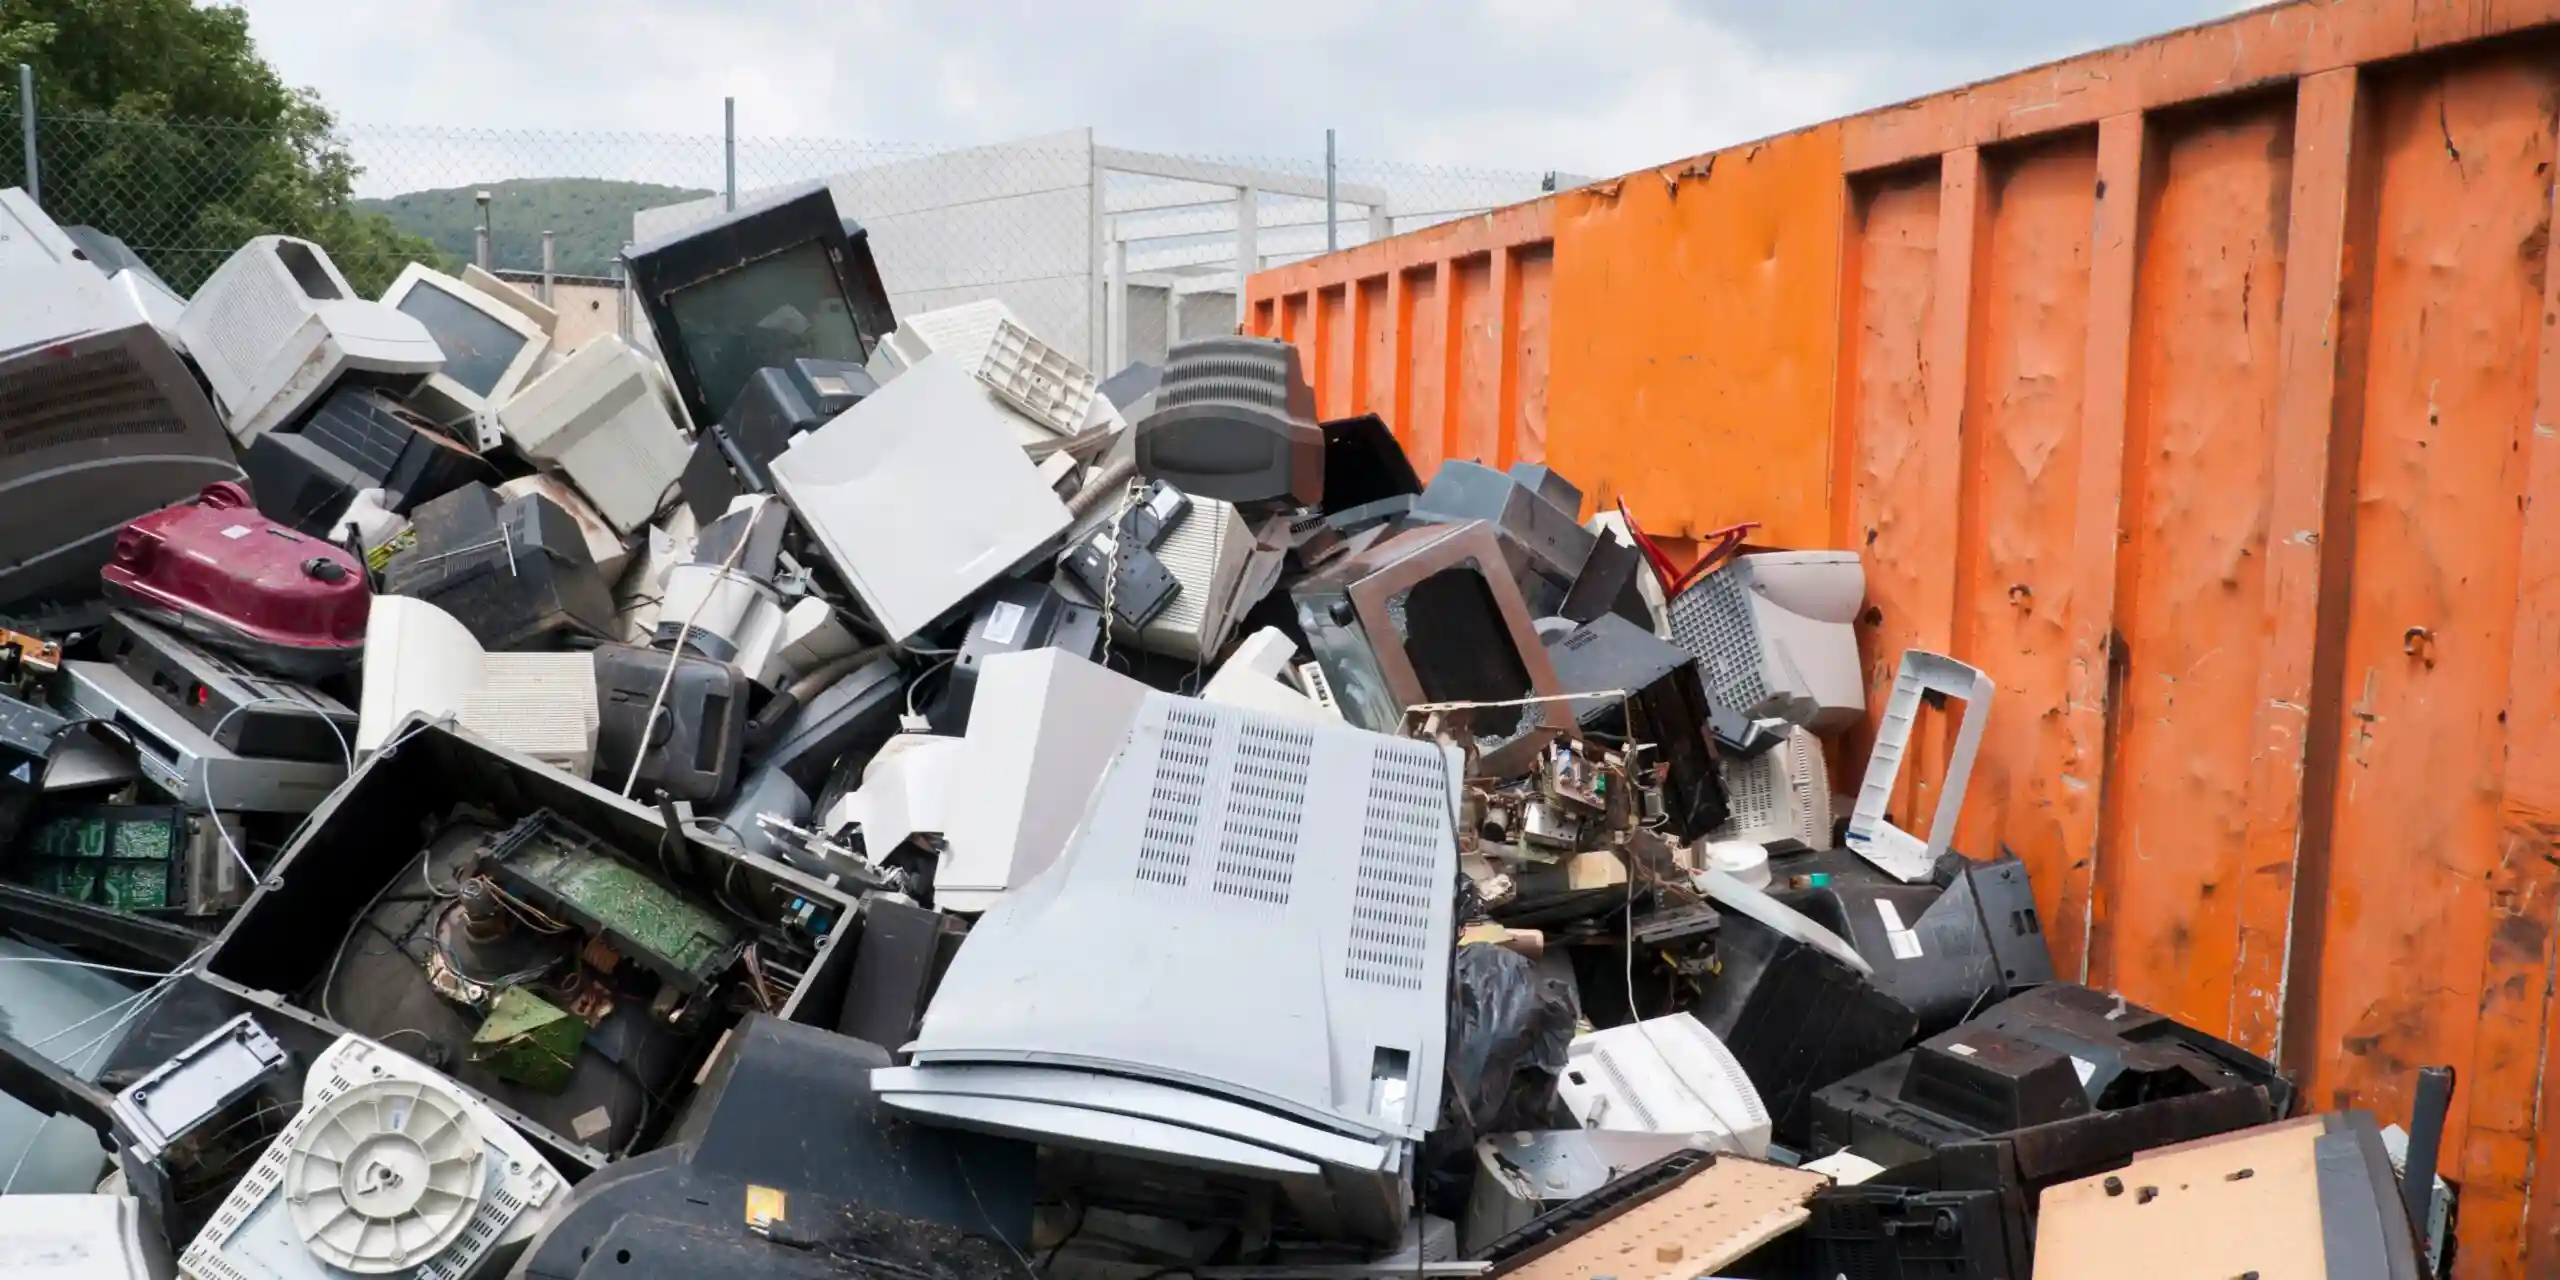
India generates 4.5M tonnes e-waste annually. Bangalore: 350K+ tonnes. 95% untreated. 12,000+ lives impacted. ₹2,000 Cr+ material value at risk. CPCB-certified recycling critical for sustainability.
2026 Quick Statistics Snapshot
E-Waste Statistics India 2026: India generates 4.5M tonnes annually (ranking #3 globally). Bangalore: 350K-400K tonnes (largest city contributor). Recycling rate: 5% nationally, 8-10% Bangalore (gap: 90-95% unmanaged). Material value: ₹2,000+ Cr annually globally, ₹150-200 Cr in Bangalore alone. Environmental impact: 12,000+ lives impacted per million tonnes unmanaged. Regulatory gap: 60% of e-waste bypasses formal recycling channels. Professional recycling represents ₹500-800 Cr market opportunity in India, with Bangalore comprising ₹50-80 Cr segment.
Table of Contents
- India E-Waste Statistics 2026: National Overview
- Bangalore E-Waste Generation: City Deep-Dive
- E-Waste Management in India: Infrastructure & Capacity
- Electronic Waste Trends in Bangalore: 2026 Forecast
- Regulatory Framework & EPR Compliance
- Environmental & Health Impact Analysis
- Recycling Infrastructure & Capacity Gap
- Future Outlook & Growth Projections
- FAQs
- Partner for Solutions
India E-Waste Statistics 2026: National Overview
E-Waste Statistics India 2026 reveal critical challenges: India generates 4.5 million tonnes annually, ranking third globally behind China (11.4M tonnes) and USA (5.4M tonnes). Growth rate: 7-8% annually—significantly exceeding global average of 2.4%. By 2026 projections, India reaches 5.2-5.5M tonnes. This accelerating generation outpaces recycling infrastructure capacity, creating 90%+ unmanaged waste crisis.
2026 National Statistics By Category
| E-Waste Category | Annual Generation (Tonnes) | % of Total | Growth Rate 2024-2026 |
|---|---|---|---|
| IT Equipment (Computers, Servers) | 1,200,000 | 26% | +8% annually |
| Mobile Phones & Telecom | 900,000 | 20% | +12% annually |
| Large Appliances (Refrigerators, AC, Washing) | 1,100,000 | 24% | +6% annually |
| Batteries & Power Systems | 600,000 | 13% | +15% annually |
| Small Appliances (Microwaves, Toasters) | 500,000 | 11% | +5% annually |
| TOTAL INDIA E-WASTE 2026 | 4,500,000 | 100% | +8% annually |
Material Value Contained in India E-Waste
E-Waste Statistics India 2026 demonstrate massive hidden value: 4.5M tonnes contains ₹2,000+ Cr in recoverable materials—precious metals (₹800-1,000 Cr), copper (₹600-800 Cr), aluminum (₹300-400 Cr), plastics (₹200-300 Cr). However, only 5% recycling rate means ₹1,900 Cr+ annual value lost to landfills, illegal dumping, and crude processing. This material waste equals ₹425 Cr/year value loss nationally.
Economic Reality: India leaves ₹1,900+ Cr annually on landfill table through improper e-waste management. Professional recycling infrastructure investment of ₹100-150 Cr could unlock ₹1,500-1,800 Cr annual recovery value—12:1 ROI potential.
Bangalore E-Waste Generation: City Deep-Dive
Bangalore E-Waste Generation reaches 350,000-400,000 tonnes annually—8-9% of India's total despite housing only 1% of population. This concentration results from: (1) 500+ IT companies generating corporate e-waste, (2) High household electronics consumption (₹50K+ annual average per capita vs. national ₹8K), (3) Active startup ecosystem, (4) Data center infrastructure, (5) Business process outsourcing operations. Bangalore's per-capita e-waste generation: 5-6 kg annually (10x national average of 0.4 kg).
Bangalore E-Waste Generation By Sector
| Sector | E-Waste Generation (Tonnes) | Key Equipment Types | Material Recovery Value |
|---|---|---|---|
| IT/Software (500+ companies) | 120,000 | Servers, computers, networking equipment | ₹30-40 Cr |
| Households/Consumers | 100,000 | Phones, appliances, computers, gadgets | ₹12-18 Cr |
| BPO/Telecom Operations | 80,000 | Telecom equipment, office electronics | ₹10-15 Cr |
| Retail/E-commerce | 50,000 | Computers, servers, logistics equipment | ₹6-8 Cr |
| Manufacturing/Industrial | 35,000 | Industrial equipment, transformers | ₹5-7 Cr |
| TOTAL BANGALORE | 375,000 | ₹63-88 Cr |
Bangalore's e-waste generates ₹63-88 Cr annual material recovery value—but only 8-10% professionally recycled. Result: ₹57-81 Cr annually lost to unmanaged disposal, illegal recycling, and environmental degradation.
E-Waste Management in India: Infrastructure & Capacity
Current Recycling Infrastructure Status
E-Waste Management in India operates through formal and informal channels. Formal sector: 180+ registered recyclers (CPCB-certified) processing ~250,000 tonnes annually (5.5% of generated waste). Informal sector: Estimated 90% of unmanaged e-waste—illegal dumping, crude backyard recycling, unauthorized exports. Infrastructure gap: Capacity to recycle only 250K-300K tonnes versus generation of 4,500K tonnes represents 94% unmanaged crisis.
CPCB-Authorized Recycling Facilities
| State | CPCB-Authorized Facilities | Processing Capacity (TPD) | % of National Capacity |
|---|---|---|---|
| Andhra Pradesh | 35 | 450 | 18% |
| Karnataka (Bangalore) | 28 | 350 | 14% |
| Tamil Nadu | 25 | 320 | 13% |
| Maharashtra | 22 | 280 | 11% |
| Delhi/NCR | 18 | 220 | 9% |
| Others (30+ states) | 52 | 550 | 22% |
| TOTAL INDIA | 180 | 2,170 TPD (793K TPY) | 100% |
Capacity Crisis: 180 facilities process 793K tonnes annually (18% capacity utilization). Infrastructure gap of 3,707K tonnes unmanaged annually. Expansion required: 800-1,000 additional facilities or 4-5x capacity upgrade to achieve 50% recycling rate by 2030.
Electronic Waste Trends in Bangalore: 2026 Forecast
Growth Trajectory 2020-2026
| Year | Bangalore E-Waste (Tonnes) | Formally Recycled | Unmanaged | Material Value (Cr) |
|---|---|---|---|---|
| 2020 | 220,000 | 15,400 (7%) | 204,600 | ₹35 |
| 2021 | 245,000 | 19,600 (8%) | 225,400 | ₹39 |
| 2022 | 270,000 | 23,760 (8.8%) | 246,240 | ₹43 |
| 2023 | 310,000 | 29,350 (9.5%) | 280,650 | ₹50 |
| 2024 | 340,000 | 34,000 (10%) | 306,000 | ₹54 |
| 2025 | 370,000 | 37,000 (10%) | 333,000 | ₹59 |
| 2026 (Projection) | 400,000 | 40,000 (10%) | 360,000 | ₹64 |
Trend Analysis: Bangalore e-waste growing at 12% annually (double India's 8% average). Recycling rate improvement minimal (7% → 10% over 6 years). Unmanaged waste accelerating faster than recycling capacity expansion. 2026 projection: 400K tonnes generation, 360K tonnes unmanaged, ₹57-62 Cr value loss.
Key Trend Drivers
- Tech Industry Growth: 500+ IT companies expanding operations—server refresh cycles generate 15-20 tonnes/company annually
- Smartphone Adoption: 85% population penetration (vs 40% national)—annual phone replacement rate 15-20%
- Data Center Expansion: 20+ large data centers (Google, Amazon, Microsoft, local operations) with 500-1,000 server refresh cycles quarterly
- EV Adoption: Battery waste emerging—battery recycling demand growing 25% annually
- Consumer Electronics: Higher disposable income (₹50K+ annual per capita) drives faster appliance replacement
Regulatory Framework & EPR Compliance
E-Waste (Management) Rules 2016
Central Pollution Control Board (CPCB) enforces E-Waste (Management & Handling) Rules 2016, amended 2018. Key provisions: (1) Extended Producer Responsibility (EPR)—manufacturers accountable for end-of-life management, (2) CPCB registration requirement for recyclers, (3) Collection target: 50% of e-waste by 2026, (4) State Pollution Control Board (SPCB) authorization, (5) Data destruction certification for equipment containing personal data.
Compliance violations trigger penalties: ₹5-10L for unauthorized disposal, ₹10-25L for non-compliance with EPR targets, criminal prosecution for hazardous material mishandling. Karnataka State Pollution Control Board (KSPCB) enforces local compliance—28 authorized facilities in Bangalore state-wide.
EPR Compliance Requirements
| Responsibility Category | Stakeholder | Key Obligations |
|---|---|---|
| Extended Producer Responsibility (EPR) | Manufacturers, Importers | Collect and recycle 50% generated e-waste by 2026 (65% by 2030). Register with CPCB. Maintain collection records. |
| Producer Organization Responsibility | Producers, Brand Owners | Establish collection centers. Partner with authorized recyclers. Finance end-of-life management. Report annually to CPCB. |
| Retailer/Distributor Responsibility | Shops, Dealers, E-commerce | Facilitate takeback programs. Maintain collection points. Support producer collection infrastructure. |
| Consumer Responsibility | Households, Offices | Segregate e-waste from regular waste. Use authorized collection centers. Avoid unauthorized disposal. |
| Recycler Responsibility | CPCB-Authorized Processors | Maintain environmental standards. Ensure safe hazardous material handling. Provide disposal certificates. Report to SPCB. |
Environmental & Health Impact Analysis
Contamination Metrics: India E-Waste Crisis
E-Waste Statistics India 2026 reveal severe environmental consequences: 4.5M tonnes unmanaged annually containing 1,200+ tonnes lead, 350+ tonnes mercury, 600+ tonnes cadmium. Improper disposal contaminates: soil (affecting agricultural productivity ₹200-300 Cr annually), groundwater (impacting 50+ million people in high-concentration areas), air quality (heavy metal particle emissions).
Health Impact Per Million Tonnes Unmanaged
- Mortality: 12,000+ premature deaths annually (respiratory, neurological, cancer)
- Morbidity: 50,000+ hospitalizations (lead poisoning, cadmium exposure)
- Developmental Impact: 100,000+ children with IQ reduction from lead/mercury exposure
- Agricultural Loss: ₹200-300 Cr crop yield reduction from soil contamination
- Water Supply: 50M+ people in impact zones consuming contaminated water supplies
Resource Conservation Through Recycling
Professional e-waste recycling prevents mining requirements: 1 tonne e-waste recycled = 100 tonnes ore mining avoided. India's 4.5M tonnes unmanaged e-waste represents 450M tonnes ore mining prevented. Environmental benefits: ₹5,000-7,500 Cr habitat preservation value, ₹1,000-1,500 Cr freshwater conservation (mining uses 500+ liters/tonne ore), ₹2,000-3,000 Cr CO2 emissions avoided.
Recycling Infrastructure & Capacity Gap
Bangalore Recycling Capacity Status
Bangalore hosts 28 CPCB-authorized recycling facilities with combined processing capacity of 350 tonnes/day (1,278 tonnes/year). Annual e-waste generation: 400,000 tonnes. Recycling rate: 10% (40,000 tonnes). Capacity gap: 360,000 tonnes annually unmanaged—requiring 110 additional facilities or 10-12x capacity expansion.
Facility Classification & Specialization
| Facility Type | Count (Bangalore) | Specialization | Processing Capacity |
|---|---|---|---|
| Integrated Processing | 8 | IT equipment, appliances, mixed e-waste | 150 TPD total |
| Specialized (IT Focus) | 12 | Computers, servers, circuit boards, precious metals | 120 TPD total |
| Battery/Power Systems | 5 | Lead acid, lithium batteries, UPS systems | 50 TPD total |
| Appliance Recycling | 3 | Refrigerators, AC, washing machines (CFC recovery) | 30 TPD total |
| TOTAL BANGALORE | 28 | 350 TPD (127,750 TPY) |
Future Outlook & Growth Projections
2030 Projections: India & Bangalore
| Metric | 2026 Actual | 2030 Projection | Growth % |
|---|---|---|---|
| India E-Waste Generation (M tonnes) | 4.5 | 6.0-6.5 | +33-44% |
| Bangalore E-Waste Generation (K tonnes) | 400 | 550-600 | +37-50% |
| National Recycling Capacity (K TPY) | 793 | 2,000-2,500 | +152-215% |
| National Recycling Rate (%) | 18% | 35-40% | +94-122% |
| Bangalore Recycling Rate (%) | 10% | 20-25% | +100-150% |
| Material Recovery Market Value (Cr) | ₹200-250 | ₹600-800 | +200-300% |
Emerging Trends 2026-2030
- Battery Recycling Surge: EV adoption acceleration drives lithium-ion battery recycling demand +25% annually (₹100-150 Cr market opportunity)
- Urban Mining Growth: Precious metal extraction technology advancement improving recovery rates 85% → 95%+
- EPR Enforcement: CPCB stricter compliance audits increasing producer responsibility accountability
- Technology Integration: IoT tracking, blockchain certification emerging for supply chain transparency
- Decentralized Processing: State-level facility expansion reducing transportation costs, improving collection efficiency
Frequently Asked Questions
Q: How does Bangalore's e-waste generation compare nationally?
A: Bangalore generates 400K tonnes annually—8-9% of India's 4.5M tonnes despite housing 1% of population. Per-capita generation: 5-6 kg annually (10x national average). This concentration results from IT industry concentration, higher household electronics consumption, and data center infrastructure.
Q: What percentage of India's e-waste is formally recycled?
A: Only 18% (793K tonnes) of 4.5M tonnes formally recycled through CPCB-authorized facilities. Remaining 82% (3.7M tonnes) disposed through illegal dumping, unauthorized recycling, or crude backyard processing. Recycling rate varies by state: Andhra Pradesh 20%, Karnataka 15%, national average 5-8%.
Q: What is the material value locked in unmanaged e-waste?
A: India's 4.5M tonnes unmanaged e-waste contains ₹1,900+ Cr material value annually—precious metals (₹800-1,000 Cr), copper (₹600-800 Cr), aluminum (₹300-400 Cr). Bangalore's 360K tonnes unmanaged represents ₹57-81 Cr annual value loss. Professional recycling infrastructure investment of ₹500-800 Cr could unlock ₹1,500-1,800 Cr annual recovery value.
Q: What are the health impacts of unmanaged e-waste in India?
A: Per million tonnes unmanaged: 12,000+ premature deaths, 50,000+ hospitalizations, 100,000+ children with developmental IQ reduction from lead/mercury exposure. Contaminated groundwater affects 50+ million people. Agricultural losses: ₹200-300 Cr annual crop yield reduction. Health costs: ₹5,000+ Cr annually.
Q: What EPR compliance targets apply to manufacturers?
A: E-Waste Rules 2016 mandate Extended Producer Responsibility (EPR): manufacturers must collect and recycle 50% of e-waste they generate by 2026, 65% by 2030. Compliance tracked through CPCB registration, annual reporting, and collection documentation. Non-compliance penalties: ₹5-10L + operational restrictions. Bangalore-based manufacturers face KSPCB enforcement.
Transform E-Waste Statistics Into Action
Bangalore's e-waste crisis demands professional solutions. KSPCB-certified recycling. 95%+ material recovery. ₹63-88 Cr annual value recovery potential. EPR compliance guaranteed.
📍 A&T Junction, Bangalore | ⏰ Mon-Sat: 9 AM - 6 PM | 📧 ewastescrap.blr@gmail.com